Get purchase intent scores and real consumer feedback on your creative — in minutes, not weeks. Whether you're A/B testing ad variants or validating a product concept, Gustoso's Quick Evaluation gets you there fast.
Best for: A/B tests, concept checks, creative pre-testing, packaging comparisons
Quick Start
Here's how to run your first ad or product test in under 5 minutes.
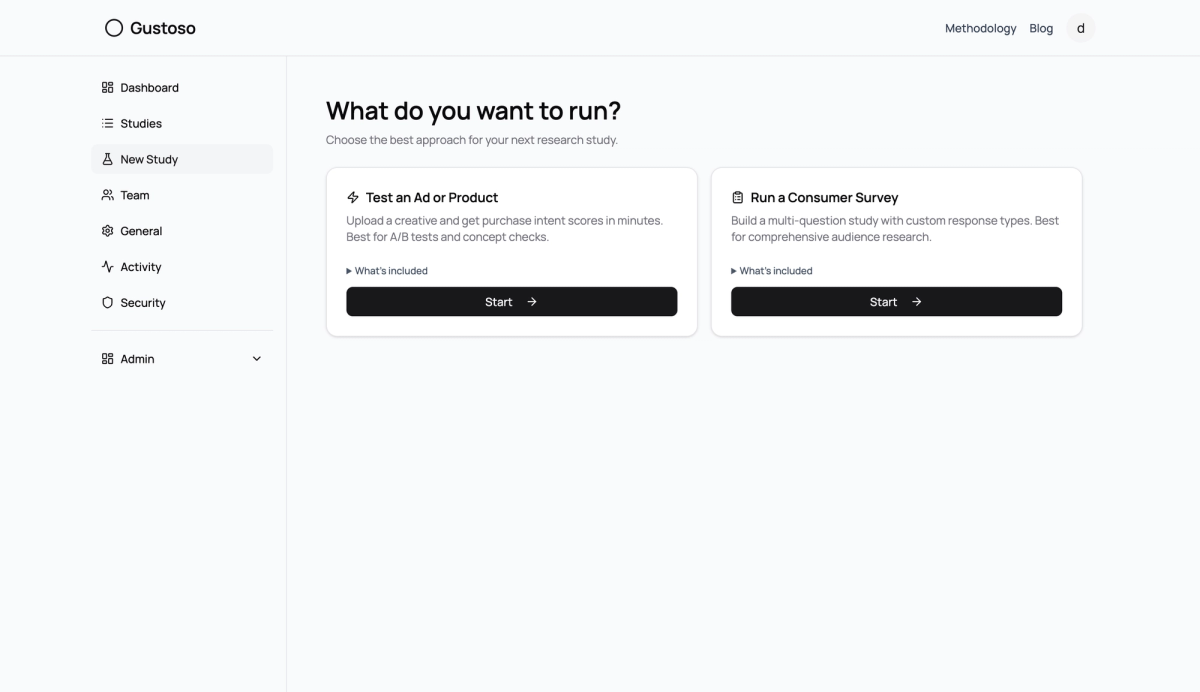
1. Choose "Test an Ad or Product"
From your dashboard, click New Study. You'll see two options — select Test an Ad or Product and hit Start.
Fig. 1
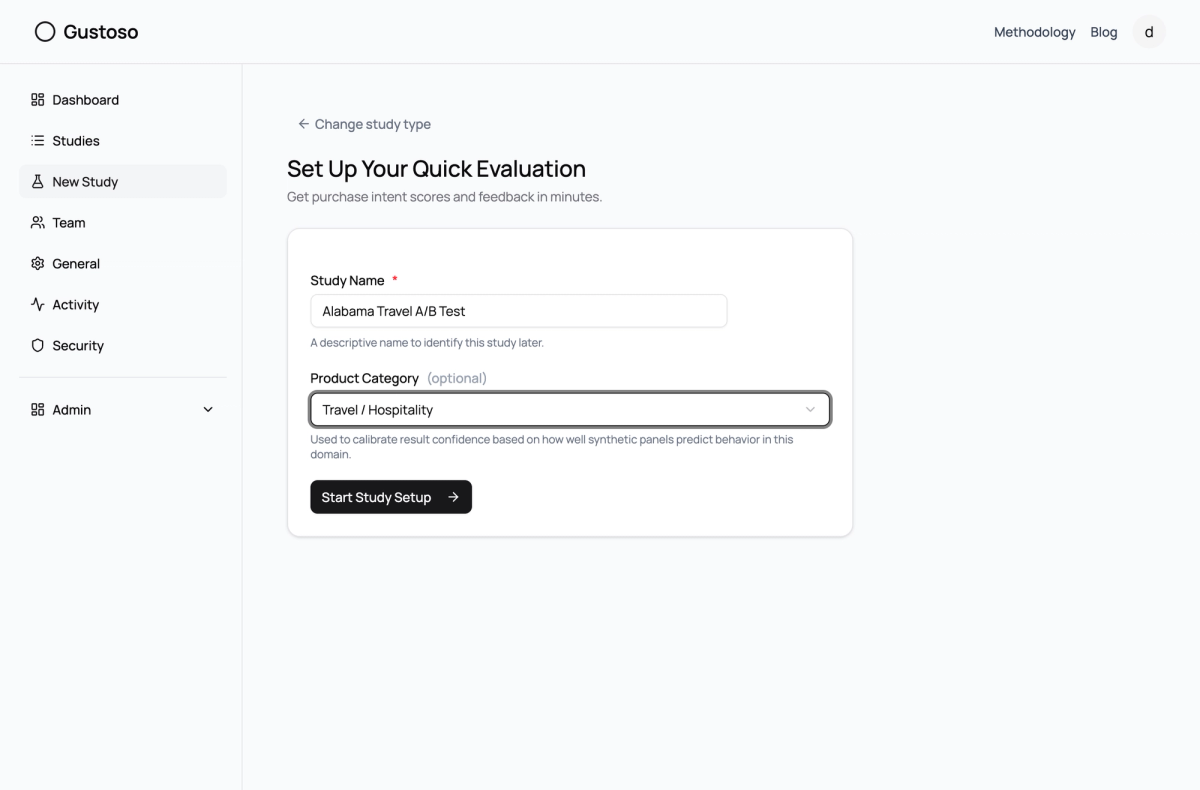
2. Name Your Study
Give your study a descriptive name (like "Summer Campaign A/B Test") and optionally pick a product category. The category helps calibrate result confidence for your industry.
Fig. 2
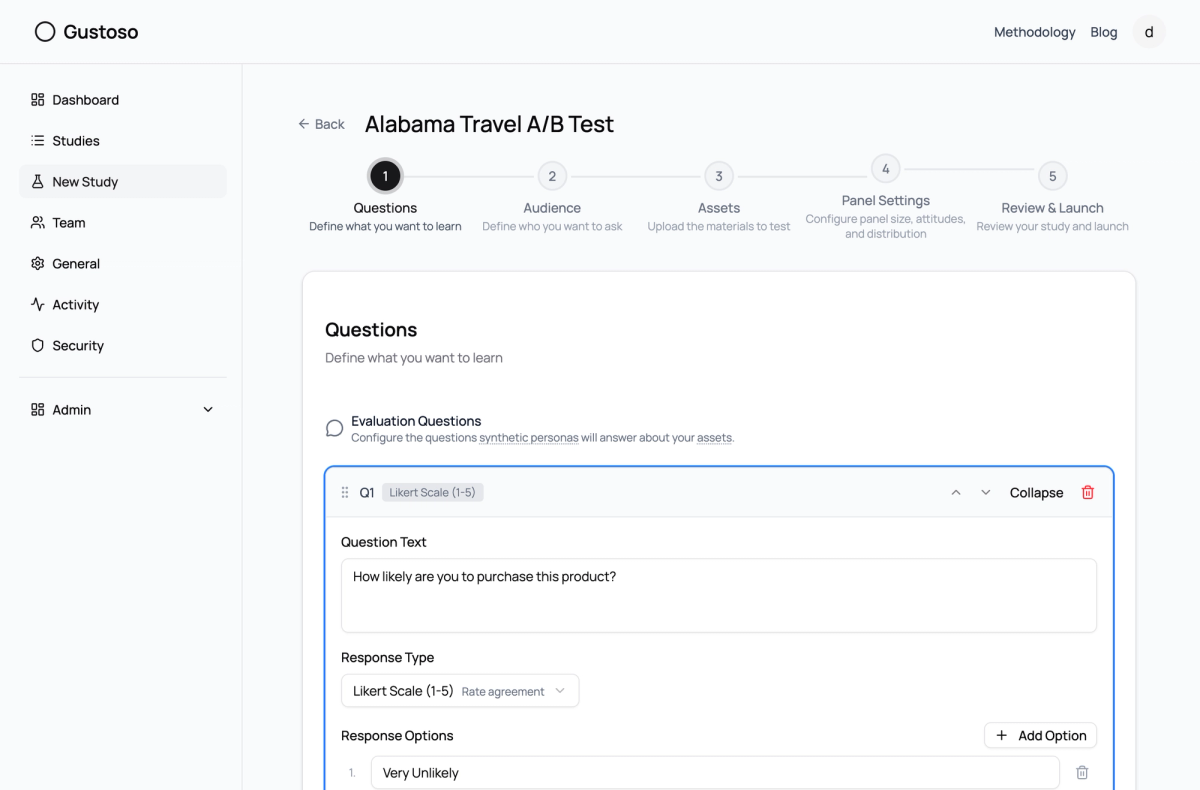
3. Set Up Your Questions
You'll start with a default purchase intent question on a Likert scale. This is the core of every quick evaluation — it measures how likely someone is to buy. You can add more questions if you want, but one is enough to get started.
Fig. 3
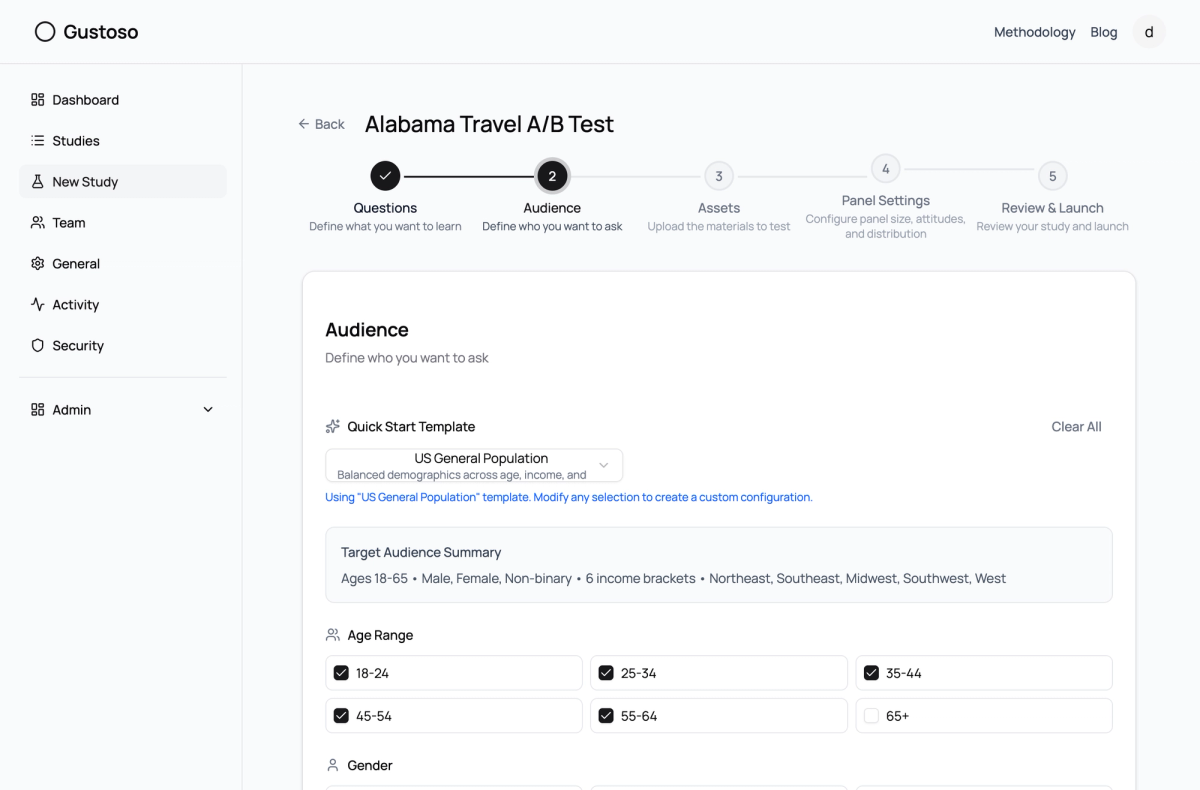
4. Define Your Audience
Pick a demographic template (like "US General Population") or build a custom audience by selecting age ranges, income levels, gender, and regions. Templates are the fastest way to get going.
Fig. 4
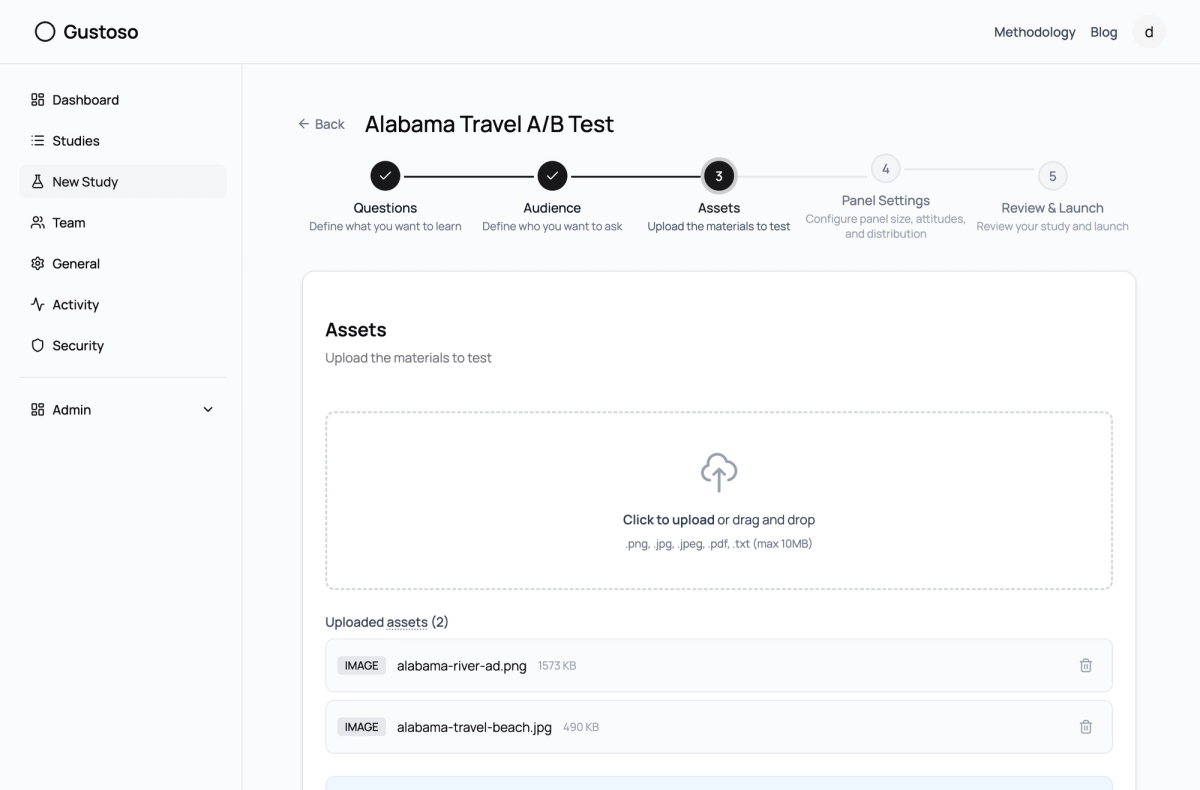
5. Upload Your Creative
Drag and drop your ad image, product mockup, or text description into the upload zone. For A/B testing, upload multiple variants and label them (A, B, C).
Fig. 5
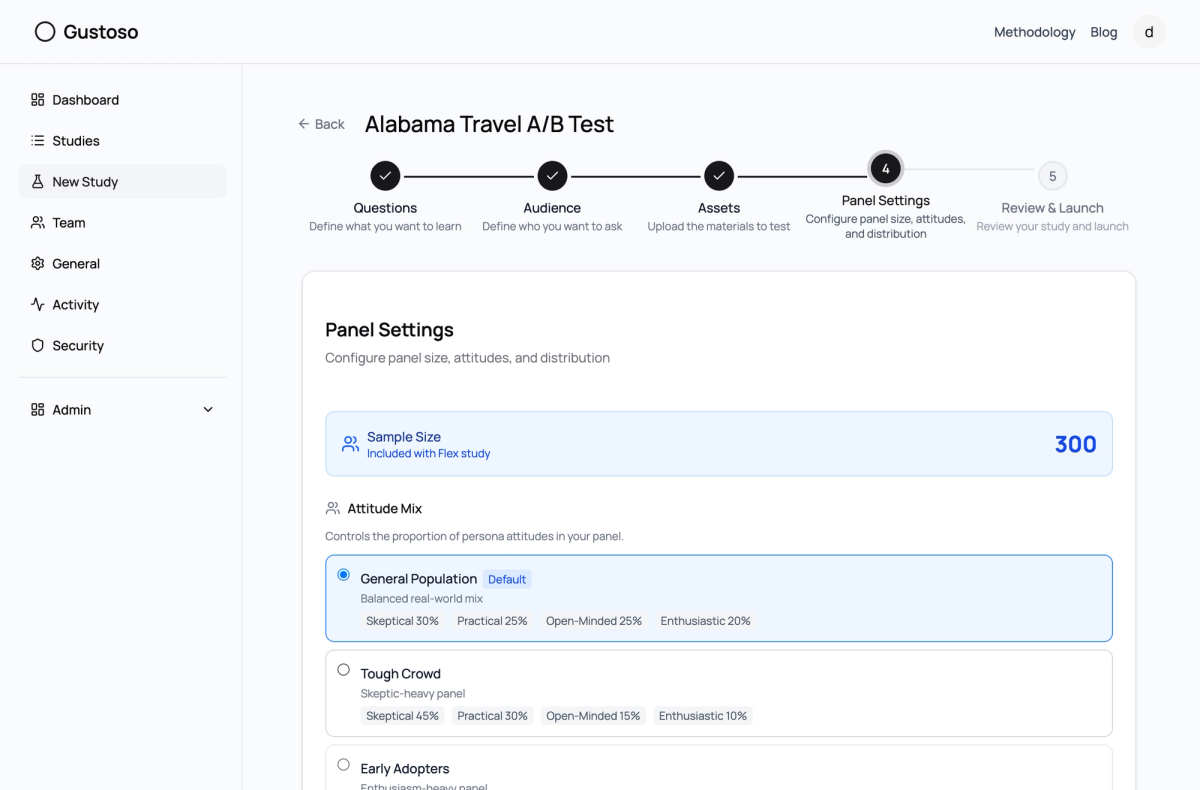
6. Set Sample Size and Review Cost
Choose how many AI personas will evaluate your creative (100-500). The default of 300 gives you solid demographic coverage. You'll see the credit cost calculated in real time.
Fig. 6
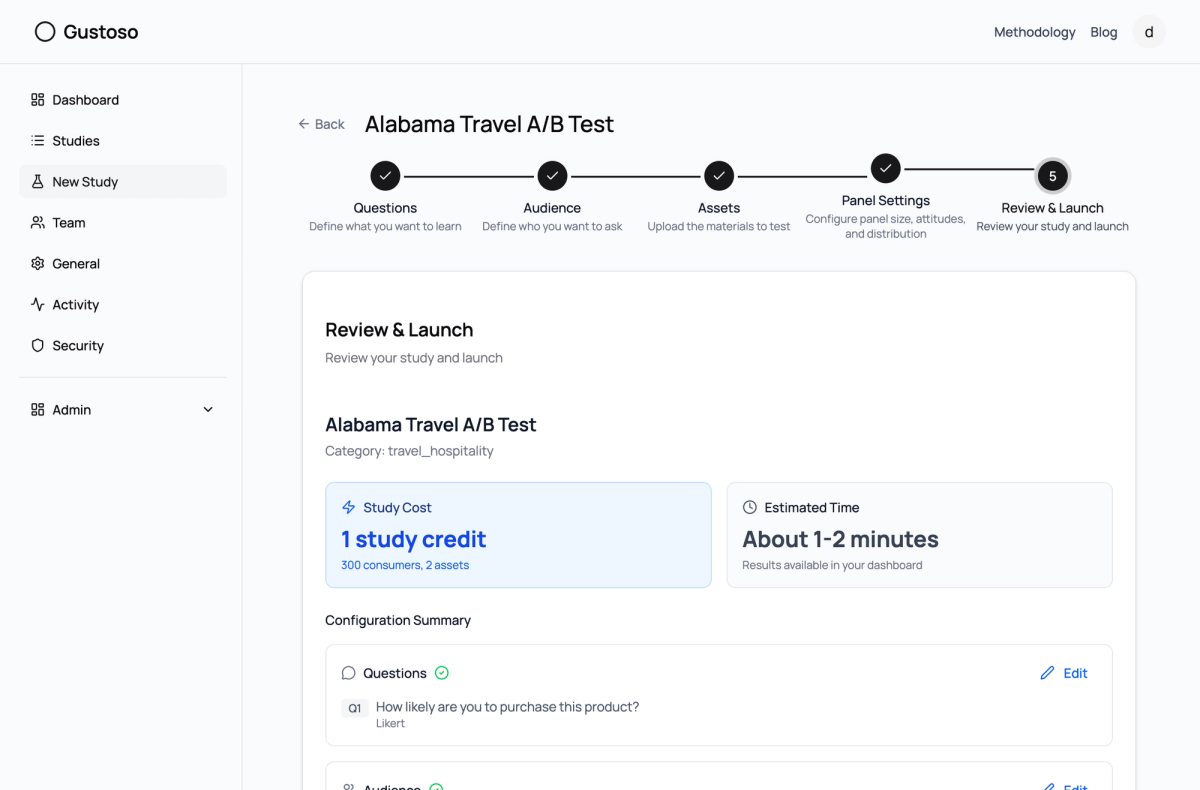
7. Review and Launch
Check your configuration one last time, accept the terms, and hit Launch Study. That's it!
Fig. 7
8. Get Your Results
Results arrive in about 1-5 minutes. You'll see purchase intent scores, Likert distributions, demographic breakdowns, and AI-generated qualitative feedback.
Fig. 8
Full Detail Guide
Ready to get the most out of your quick evaluation? Here's everything each step offers.
Understanding Question Templates
The default question — "How likely are you to purchase this product?" — uses a 5-point Likert scale from "Very Unlikely" to "Very Likely." This is the industry standard for measuring purchase intent. You can also add questions from these templates:
- Appeal — "How appealing is this product to you?" Measures emotional reaction.
- Clarity — "This concept is clear and easy to understand." Tests messaging comprehension.
- Uniqueness — "This product is different from others I've seen." Gauges differentiation.
- Open Feedback — A free-text question that captures qualitative insights you might not have anticipated.
Choosing the Right Audience
Templates are pre-configured demographic profiles designed for common use cases:
- US General Population — Ages 18-65, all income levels, balanced gender, all regions. Your go-to for broad market testing.
- Urban Millennials — Ages 25-34, mixed income, urban areas. Great for trendy consumer products.
- Budget-Conscious Families — Ages 35-54, lower-middle income. Ideal for value-oriented products.
- Affluent Professionals — Ages 25-54, high income, urban. Perfect for premium products.
- Gen Z Early Adopters — Ages 18-24, tech-forward. Best for new tech and innovative products.
Pro tip for A/B testing: Use the same demographic settings across all your variants. This ensures differences in scores come from your creative, not your audience.
Asset Tips
- Supported formats: PNG, JPG, PDF, and plain text files (max 10MB each, up to 10 per study)
- For A/B tests, upload each variant and label them A, B, C using the variant labels. Results will be broken down per variant.
- Text descriptions work too — don't have a visual yet? Upload a text file with your product description or ad copy.
- Image quality matters — use production-quality images when possible. Low-res placeholders may affect how personas perceive your product.
Understanding Credit Costs
Credits are calculated as: Base cost (personas x 1 credit each) + Evaluation cost (personas x questions x assets). For example, 300 personas with 1 question and 2 assets = 300 + (300 x 1 x 2) = 900 credits.
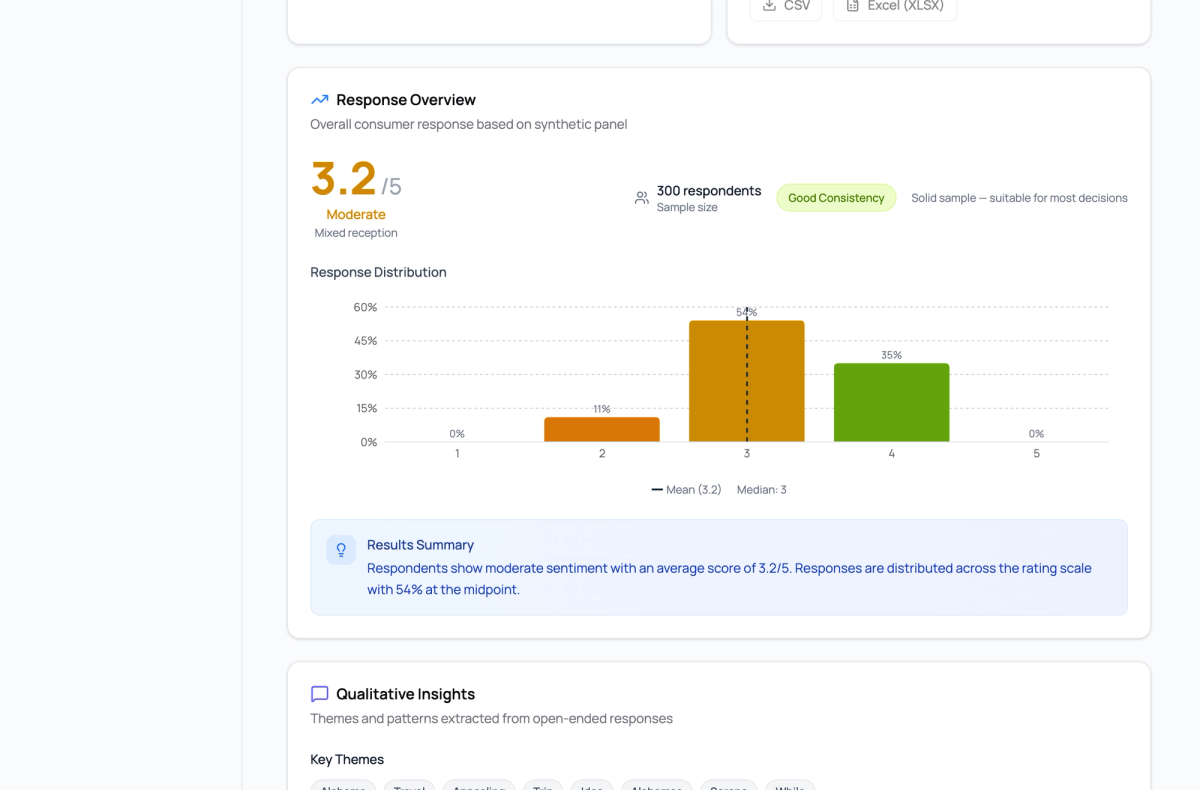
Reading Your Results
Your results page shows:
- Overall Score — The average Likert score across all personas (1.0-5.0). A score of 3.5+ generally indicates positive purchase intent.
- Response Distribution — A bar chart showing how many personas chose each Likert option.
- Demographic Breakdown — See how different age groups, income levels, genders, and regions responded.
- Statistical Confidence — Confidence intervals and sample size impact analysis.
Fig. 9
What's a Good Score?
- 4.0+ — Strong purchase intent. Your creative is resonating.
- 3.5-4.0 — Moderate intent. Consider tweaking your message or targeting.
- Below 3.0 — Weak intent. Major revision recommended.
Ready to test your next campaign? Create your first study